This article scratches the surface of how oil is used and traded within the world’s energy complex. We introduce linear optimisation utilising AMPL to understand the optimal outputs from a fictitious refinery.
This article explores using data to uncover latent streams of returns, otherwise known as factors. We jump into the world of rotations to make sense of the factors and show how to ensure stability when used for real-world trading.
Returns can be viewed as a product of an underlying market regime. This article models those regimes and shows how to extend the model with macroeconomic variables to link regimes to observable economic indicators.
A practical crash course on conditional value at risk. Why it beats value at risk, how to estimate it from real data, and how to optimise portfolios with it. Complete with working code.
Keep research and production outputs aligned with rec tests. This article explains the concept and introduces a tiny Python library for clean, tolerance-aware tests.
A 2025 guide to the best Python tools for quants—from fast package managers and powerful linters to type checkers and test runners. Includes example configs.
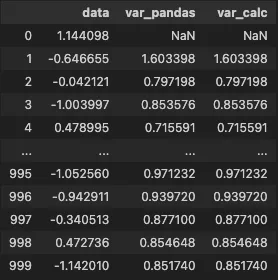
In this article, we explore three techniques to improve covariance matrix estimation: evaluating estimates independently of backtests, decoupling variance and correlation, and applying shrinkage for more robust outputs.
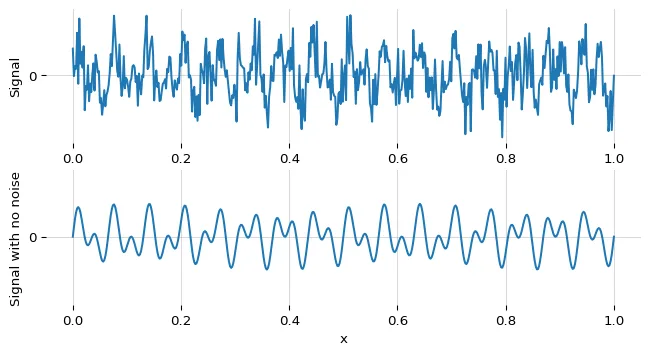
There’s a magical little theorem that links a power spectral density to the autocovariance function. You can use this to quickly estimate a Gaussian process of a periodic time series.
I summarise key insights from a few papers studying the limit order book. You’l learn how to measure volume imblanace in the limit order book and how well it predicts price moves.
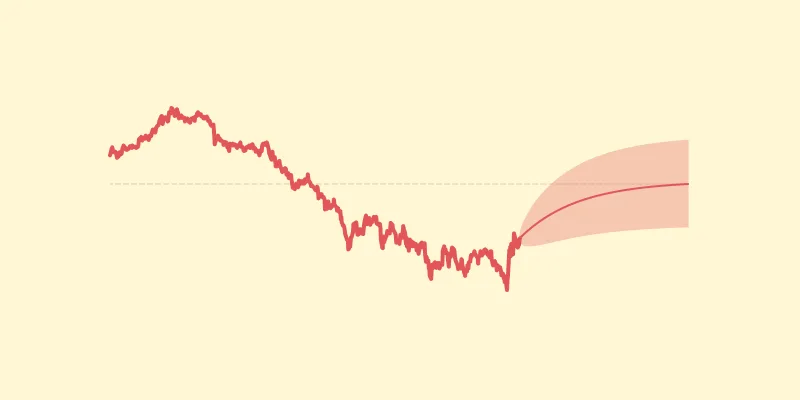
Fractional Brownian motion is a stochastic process that can model mean reversion. Predicting future values turns out to be a simple linear model. This model has significant predictive power when applied to currencies.
The square root of your portfolio’s covariance matrix gives you a powerful way of understanding where your portfolio variance is coming from. Here I show how to calculate the square root and provide an interactive example to explore how it works.
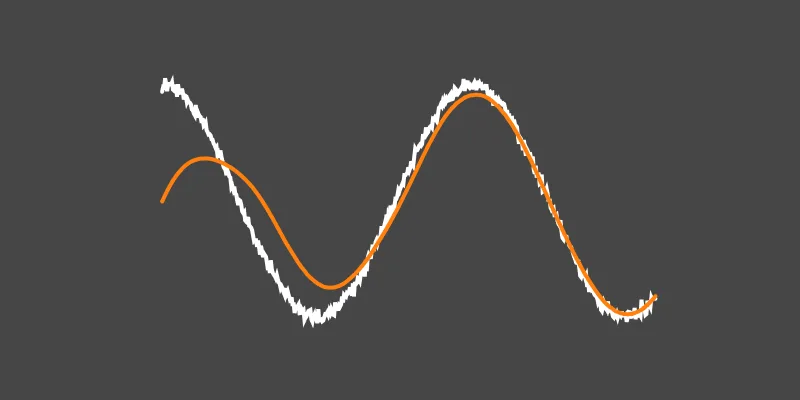
Rather than recalculating a least–squares model on each new data point, you can simply update the fitted coefficients. This saves you computational time and allows you to place greater emphasis on recent data.
Poorly monitoring your trading strategy means you are missing mistakes and leaving money on the table. By converting your bot’s logs from plain text to JSON you can create a near real time monitoring system and never miss a beat.
Using the Ornstein–Uhlenbeck process, you can calculate the expected spread between bond yields of different maturities. These expected values can then be used to estimated the expected value of treasury ETF spreads.
Bond returns are a function of yields. Calculating the expected value of this function is quite difficult. You can take a Taylor expansion to make calculating the mean and variance of returns much easier.
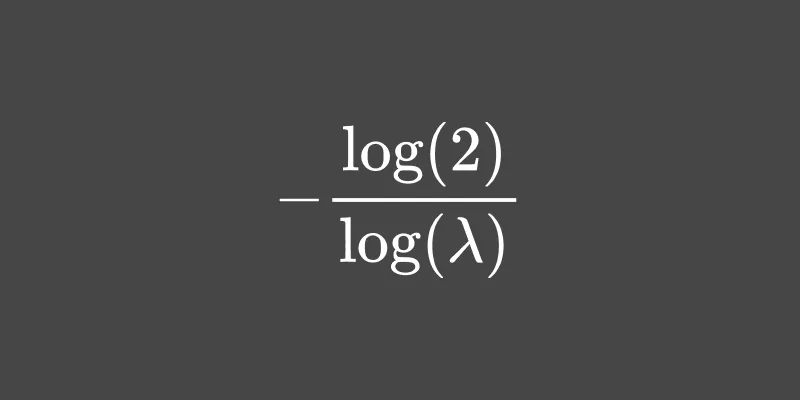
The half-life of a stationary series can be estimated with a linear regression. These notes show the derivation of the half-life from the regression coefficients.




 research.io