I always find myself in the unknown charted territory when it comes to non-Linear Instruments. I come across the scenario, How to value the option using Delta Vol surface? Example I have CME traded Soybean option(900 strikes, Underlying traded future (spot) trading at 880 USD-cents/BU) with dec maturity and delta surface from the Bloomberg. a) I need to plug out implied volatility from the del…
CME Group, the world’s leading derivatives marketplace, announced its new Bitcoin Volatility Index futures are now available for trading. First trades were executed as blocks between DV Chain and Monarq Asset Management.
“The early support we’ve seen for our new Bitcoin Volatility futures further demonstrates the growing client demand for more innovative tools to more efficiently protect against …
assuming the usual FX vol surface conventions are correctly set for the given market: how do I extract the 3D Bloomberg implied vol surface. I understand that the data from their implied vol table form the basis of our interpolation and that you can export to Excel. However, I would like to fit the implied vol surface and see how different methods behave relative to Bloomberg or Murex's surface -…
I have a target underlying asset for pricing, but I only have the spot price for it. I’m looking for proxies for which I have the spot price, forward price, and implied volatility. I already have a mechanism that allows me to select the proxy based on correlation, cointegration, and return volatility!
Now, I’d like to construct the implied volatility of my target underlying asset!
Do you have any…
I am trying to understand the intuitive reasoning for why volatility is more for deep OTM/ITM put/call then ATM..(why Simles for equity) Why ATM will not have more volatility as deep OTM/ITM option will be less likely to be exercised.. Thanks for the help!!
In volatility targeting annualised rolling volatility is estimated using a lookback window or an exponentially weighted moving average . The recursive EWMA formula for variance is: $$\sigma_t^2 = (1 - \alpha) \sigma_{t-1}^2 + \alpha r_t^2$$ where $\alpha = \frac{2}{1+N}$ , and $N$ is the equivalent lookback window length. The non-recursive form, using $\lambda = 1 - \alpha$ , the variance is: $$\…
I would like to know what is the most reasonable way to measure volatility in a sample of past observations. Aside from standard deviation, are more complex models like GARCH used for (historical) volatility measurement if one is not interested in forecasting future volatility? For context, as mentioned in a comment below, I need a measure of past monthly volatility to study the relationship betw…
I’m working with an order book that contains the 10 best bid and 10 best ask levels. A common approach for estimating volatility is to use the mid-price, typically computed from the first best bid and first best ask. However, this method only considers the top level of the book and neglects the information provided by the other levels, which may be relevant—especially if orders at those levels ar…
Realized volatility is autocorrelated, that could be due to either: Latent volatility takes time to change, thus, time periods close together have similar latent volatility. There's a causal relationship between realized and latent volatility. Higher realized volatility now causes higher latent volatility later. Which one is correct?
Problem: Correct usage of GARCH(1,1) Aim of research: Forecasting volatility/variance. Tools used: Python Instrument: SPX (specifically adjusted close prices) Reference material: On Estimation of GARCH Models with an Application to Nordea Stock Prices (Chao Li, 2007) Note: I have checked almost all the Quant.SE posts discussing GARCH, but I have not seen any of them with the approximate nature of…
This is a summary of links recently featured on Quantocracy as of Monday, 05/04/2026. To see our most recent links, visit the Quant Mashup. Read on readers! Deep Learning for Volatility Surface Repair [Jonathan Kinlay] A self-contained synthetic benchmark of a small mask-conditional CNN against calendar-projected linear interpolation and a per-slice SVI fit. A volatility […] The post Recent Quant…
A self-contained synthetic benchmark of a small mask-conditional CNN against calendar-projected linear interpolation and a per-slice SVI fit. A volatility surface marker is rarely a clean rectangle of quotes. Strikes go unobserved during illiquid hours, wings get crossed and then erased, broker stripes drop out across an entire maturity, and weeklies arrive at the desk … Continue reading "Deep Le…
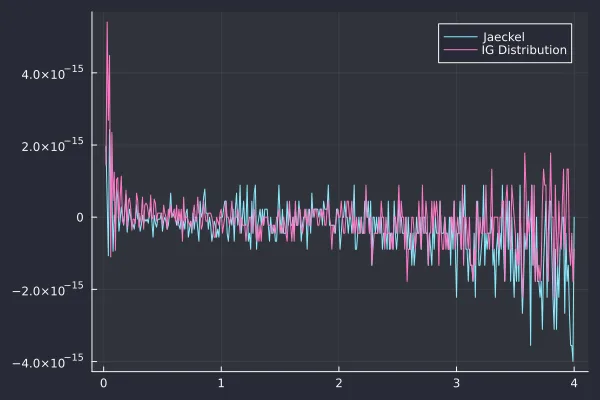
Several years ago, I had explored accuracy and performance of different ways to imply the Black-Scholes volatility. Jherek Healy proposed some improvements over my naive algorithm on his blog . Recently, a Linkedin post mentioned a new paper from Wolfgang Schadner which presents an almost explicit formula for the implied volatility. Almost because it actually relies on some implementation of the …
" This paper identifies what appears to be the first explicit formula for Black–Scholes implied volatility, resolving a 50-year-old problem in option pricing. The key observa tion is that the call price can be written as a survival probability of an inverse Gaussian distribution." https://arxiv.org/pdf/2604.24480 Statistics: Posted by Collector — 39 minutes ago
I've been trying to learn options math and am getting hung up on a basic misunderstanding. From what I have gathered, to get a single day volatility from annualized volatility, you would do something like this - var dailyVol = impliedVol / sqrt(1.0 / 365); My assumption would then be that if I want to find an "x sigma" daily move to the upside or downside, I would do the following - var newPrice …
In this paper, we consider estimating spot/instantaneous volatility matrices of high-frequency data collected for a large number of assets. We first combine classic nonparametric kernel-based smoothing with a generalized shrinkage technique in the matrix estimation for noise-free data under a uniform sparsity assumption, a natural extension of the approximate sparsity commonly used in the literat…
We introduce a multi-scale stress accumulation framework for identifying regimes of elevated future volatility in financial time series. The model constructs a binary stress signal based on extreme return events and aggregates it using exponential weighting across fast, intermediate, and slow temporal scales. To ensure adaptability across changing market conditions, stress regimes are defined usi…
I use QLIKE as loss function to evaluate the forecasting performance of a RV realized volatility model. QLIKE = log $h$ + $\frac{\hat{\sigma}^2}{h}$ where $h$ is volatility forecast and $\hat{\sigma}^2$ is the ex post value of volatility (realized volatility computed with intraday returns). If I proxy volatility with log(RV), what are $h$ and $\hat{\sigma}^2$ in the QLIKE? The forecast and ex pos…
I want to calculate implied volatility of american option of a short term interest rate future. Let's take for example a put option for a SOFR future with $K=95, price=0.105, T=0.750685, underlying=95.505$ I currently use as a first approximation the implied vol by using finding implied vol using the Bachelier model (used to price European options from my understanding). The undiscounted price fo…
option-pricingquant-financevolatility-modeling
research.io
Sign up to keep scrolling
Create your feed subscriptions, save articles, keep scrolling.