Pave Finance, an AI-powered portfolio management platform for financial advisors, announced it raised over $15 million in an oversubscribed Series A round, achieving a $100 million pre-money valuation. The round followed a $14 million oversubscribed seed round in September 2025 and included investment from advisory firms and former executives of leading financial services companies. Advisors […]
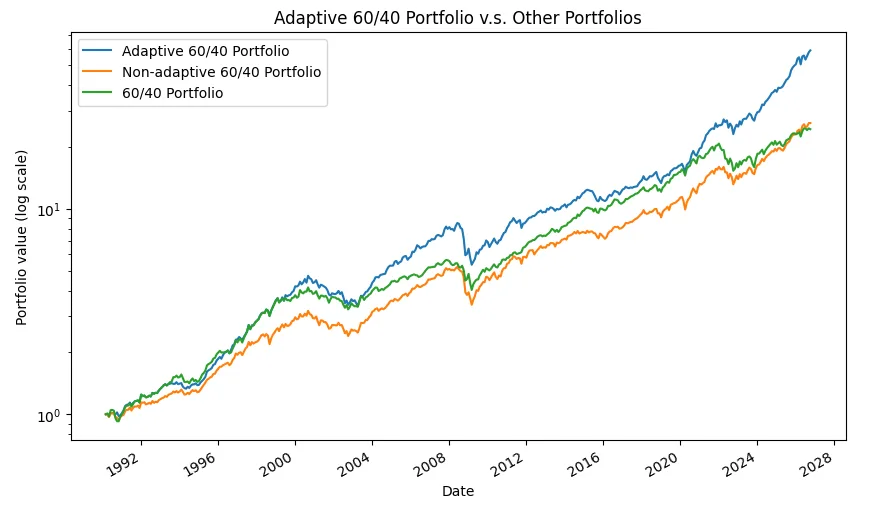
Welcome to 2026, where bonds no longer diversify stocks, volatility remains elevated and inflation isn’t going anywhere1. This is the dramatic, although factual, opening of Basis Points’s video Morgan Stanley’s asset allocation playbook for the next 5 years. As a consequence, the 60/40 Portfolio - invested 60% in stocks and 40% in bonds - which for decades has stood as the institutional benchmark…
I’m currently at a smaller prop firm that, as I understand it, is structured as a family office for legal and financial reasons. I’ll be allocated firm capital and given my own book to trade. I’m curious whether spending 1–2 years here could be a good stepping stone to a larger prop firm or hedge fund. Assuming I develop a solid trading process and track record, how would that experience be viewe…
Why MtM declines drive two-thirds of crisis losses: deconstructing CVA spikes during the 10-day MPoR window, the xVA framework, and Basel III SA-CVA rules.
📊 Deep Research
Topics: quantitative finance, investment analysis, financial education, financial research, market analysis
Hello all,
We hope you had a great end to the summer, whether August meant a final holiday or a return to the office. Here’s a quick recap of the latest developments we prepared for Quantpedia in the last days of summer...
– new report in the Live Strategies section called Composite Analysis
– 11 new Quantpedia Premium strategies
– 5 new related research papers
– 8 new backtests
– and finally, …
I am trying to decompose Vega PnL into ATM vol, skew, and curvature components. To that end, I am building an SVI model and using the SVI-JW parameterization to attribute Vega PnL via the following formula: $VegaPnL = Vega \times dVol \approx Vega \times (\frac{dVol}{dv_t}dv_t+\frac{dVol}{d\psi_t}d\psi_t + \frac{dVol}{dp_t}dp_t + \frac{dVol}{dc_t}dc_t + \frac{dVol}{d\tilde{v}_{t}}d\tilde{v}_{t})$…
Your correlation matrix is lying to you. Here's the fix — and it comes from insurance math. In the first article, I built a stock market crash simulator using insurance catastrophe modeling. One layer of that tool changed my thinking more than any other: the vine copula. It's the mathematical answer to a question every investor has felt but few can articulate: Why does my "diversified" portfolio …
Quant strategies group instruments for portfolio construction, risk aggregation, statistical arbitrage, and trade surveillance, but incorrect groupings can obscure risk and fail under stress. AdaptGrow, a GPU-accelerated matrix factorization algorithm, turns correlation and tail-dependence matrices into clusters and factor loadings at single-GPU and multi-node scale.
I've often seen 2-3 different ways factor models are constructed, but I don't understand when do you use one approach, the benefits. I do have some intuition but really looking for some industry context here Long-Short portfolio based on some ranking : Eg. Take P/B ratio sort all stocks and then create a ranking, go long the top quantile and short the bottom. You've a value factor portfolio. Do s…
Average strategy performance is one of the most common shortcuts in portfolio research. It gives the researcher a clean benchmark, a single reference line, and a simple way to compare one strategy against a broader group of similar strategies. In many cases, this is useful. But it can also be misleading.
The problem is that an average hides dispersion. Two peer groups can have the same average r…
Time-series momentum stands as one of the most reliable and heavily backtested anomalies in quantitative finance, serving as a foundational alpha source for modern managed futures and trend-following strategies. However, a recent academic paper by Matti Suominen and Erik Hjalmarsson, titled "Boundaries of Time Series Momentum," uncovers a structural vulnerability that every practitioner must acco…
A backend developer with 20+ years across India and the US, Santanu Nandi used EPAT to turn a long-standing interest in trading into a systematic path forward.
Plan your financial life against real market history.
A complete retirement planner that stress-tests your whole plan against a century of real market history, not a statistical average.
Part of a series on building Balance , a portfolio rebalancing app, as a solo developer. Balance started as a Brazilian-only app: B3 tickers, prices in reais, Brazilian income tax. Then came US stocks. Then crypto. The naïve path would have been three apps glued together — three price fetchers, three sets of forms, three rebalancing engines. Instead, the whole thing pivots on a single field: clas…
The Sharpe Ratio1, one of the most commonly used measure of risk-adjusted performance2, is usually reported as a point estimate (Morningstar, Quantalys, etc.). Thanks to the work of Lo3, Opdyke4 and more recently5 de Prado et al.6, it is nevertheless well understood that such a point estimate […] does not convey information about statistical significance6, so that a more meaningful way to measure…
SEBI Research Department released earlier studies on profits and losses (mostly losses) of retail traders in derivatives markets in 2023 and 2024. Both showed 90 percent of traders made losses leading to lots of discussions. SEBI took some measures to slowen trading activity in derivatives. The 2026 study shows though losses have declined but investors […]
SEBI research team has released a study on trading behaviour of derivatives traders: 1. The study indicates that equity derivatives trading by individual investors is characterized by high trading intensity,particularly in short- duration options contracts, with a large proportion of trading concentrated in contracts nearing expiry. 2. Trading activity is predominantly concentrated among relative…
I am reading Harry Markowitz’s “ Portfolio Selection ” ( Journal of Finance , 1952), and I cannot determine whether Figure 4 contains a labeling error or whether I am misunderstanding the paper. On PDF page 11 (journal page 86), Figure 4 shows a three-dimensional coordinate system with axes $X_1$ , $X_2$ , and $X_3$ , together with three lines labeled $l_{1234}$ , $l_{234}$ , and $l_{124}$ . On t…



 research.io