In a previous blog post of this series, the main univariate Value-at-Risk (VaR) estimation methods were described. Among these, and for scenario-based VaR estimation like historical VaR or Monte Carlo VaR, the most widely used [non-parametric] estimator is the corresponding order statistic of the empirical quantile of the portfolio return distribution, or a linear combination of two subsequent or…
The NAAIM Exposure Index represents the average exposure to U.S. equity markets as reported by members of the National Association of Active Investment Managers (NAAIM) in a weekly survey. That index, like any other sentiment indicator, is a useful gauge of the possible future direction of a market1 that can be incorporated into one’s asset allocation process. In this blog post, I will analyze an…
The fact that mean-variance optimizers are highly sensitive to changes in expected returns […] is well known in investment practice1, with a couple of practical solutions already described in this blog, for example using near efficient portfolios or subset resampling-based efficient portfolios. In this blog post, I will introduce another approach originally described in Sharpe2 and known as rever…
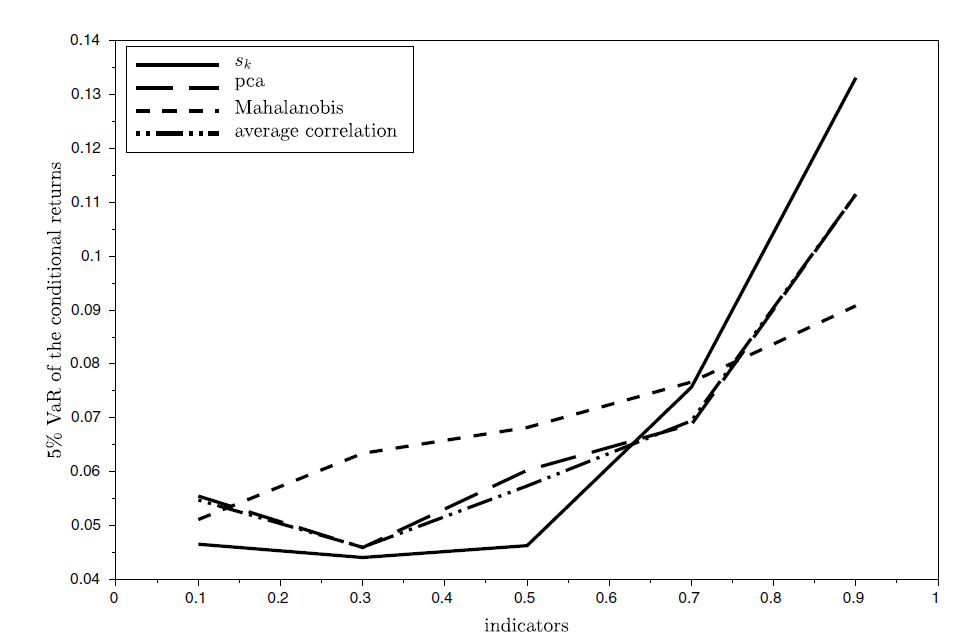
In the previous post of this series on measuring financial risk, I described the absorption ratio, a measure of financial market fragility based on principal components analysis, introduced in Kritzman et al.1. In this new blog post, I will describe another measure of financial distress called the market rank indicator (MRI), this time related to the notion of condition number2 of a matrix, intro…
In a previous article, I described several classical bootstrap techniques — i.i.d. bootstrap, circular block bootstrap, and stationary block bootstrap — and showed how the stationary block bootstrap could be used to simulate future price paths for financial assets by following the methodology of Anarkulova et al.1. In this blog post, I will detail another bootstrap technique called the autoregres…
The previous post of this series on mathematical problems related to correlation matrices introduced the nearest correlation matrix problem1, which consists in determining the closest2 valid correlation matrix to an approximate correlation matrix In this blog post, I will now describe the correlation matrix completion problem, which consist in filling in the missing coefficients of a partially sp…
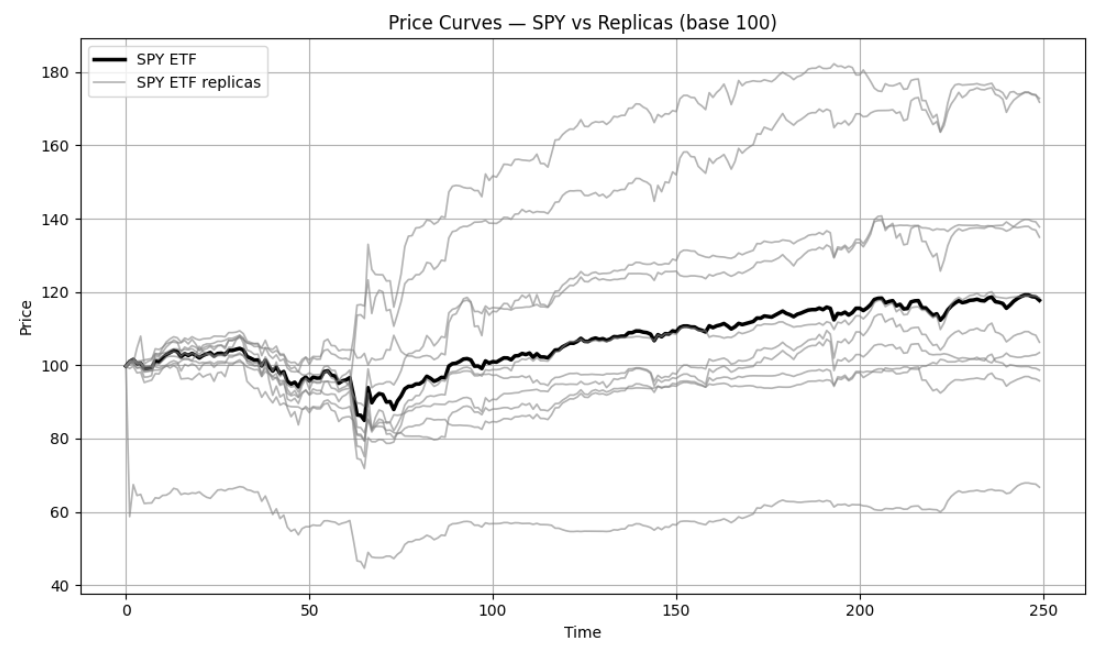
Continuing this series on covariance matrix forecasting (c.f. here and there for the previous posts), I will now describe a relatively recent1 data-driven, model-free, way to [forecast] covariance [and correlation] matrices of time-varying systems2 rooted in random matrix theory. This method - introduced in Bongiorno et al.2 and called Average Oracle - consists in replacing the eigenvalues of a (…
Value-at-Risk (VaR) is one of the most commonly used risk measures in the financial industry1 in part thanks to its simplicity - because VaR reduces the market risk associated with any portfolio to just one number2 - and in part due to regulatory requirements (Basel market risk frameworks34, SEC Rule 18f-45…). Nevertheless, when it comes to actual computations, the above definition is by no means…
Standard portfolio allocation algorithms like Markowitz mean-variance optimization or Choueffati diversification ratio optimization usually take in input asset information (expected returns, estimated covariance matrix…) as well investor constraints and preferences (maximum asset weights, risk aversion…) to produce in output portfolio weights satisfying a selected mathematical objective like the …
Clustering consists in trying to identify groups of “similar behavior”1 - called clusters - from a dataset, according to some chosen characteristics. An example of such a characteristic in finance is the correlation coefficient between two time series of asset returns, whose usage to partition a universe of assets into groups of “close” and “distant” assets thanks to a hierarchical clustering met…
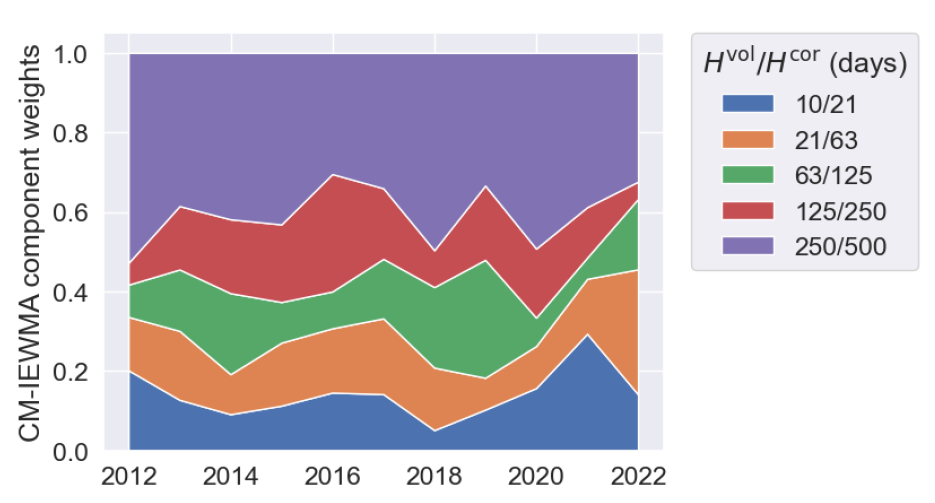
In this series on volatility forecasting, I previously detailed the Heterogeneous AutoRegressive (HAR) volatility forecasting model that has become the workhorse of the volatility forecasting literature1 since its introduction by Corsi2. I will now describe an extension of that model due to Bollerslev et al.3, called the Heterogeneous Exponential (HExp) volatility forecasting model, in which the …
Whether we manage our own investment assets or choose to hire others to manage the assets on our behalf we are keen to know how well our […] portfolio of assets is performing1 and the calculation of portfolio return is the first step in [that] performance measurement process1. Now, while the matter of measuring the rate of return of [a portfolio] appears, on the surface, to be simple enough2, the…
In the previous post of this series on covariance matrix forecasting, I reviewed both the simple and the exponentially weighted moving average covariance matrix forecasting models, which are straightforward extensions of their respective univariate volatility forecasting models to a multivariate setting. With these reference models established, we can now delve into more sophisticated approaches …