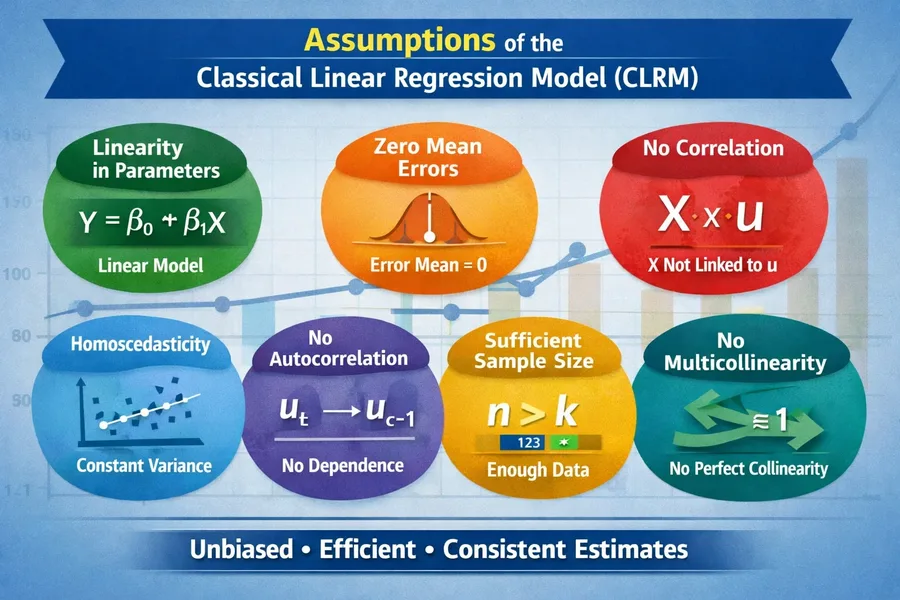
The Classical Linear Regression Model (CLRM) is the foundation of econometrics. It ensures that Ordinary Least Squares (OLS) estimators are BLUE — Best Linear Unbiased Estimators. For this to hold true, certain assumptions must be satisfied. Let’s explore them step by step. 1. Linearity in Parameters 2. Zero Mean of Error Term 3. No Correlation […]
The Efficient Market Hypothesis (EMH) is a financial theory that holds that asset prices reflect all available information. According to this view, securities consistently trade at their true value because the market processes all available information. As a result, it is considered highly unlikely for an investor to consistently outperform the overall market through stock […]
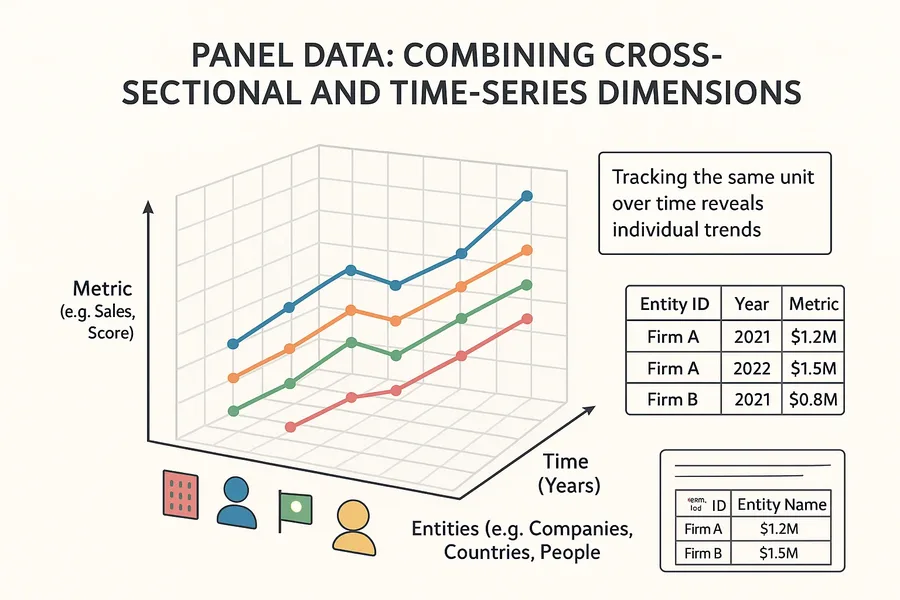
1. Introduction to Panel Data Analysis Panel data, also known as longitudinal data, represents a powerful statistical framework that combines both time series and cross-sectional dimensions, enabling researchers to track the same subjects over multiple time periods. This unique data structure has revolutionized empirical research across numerous disciplines by providing deeper insights into dynam…
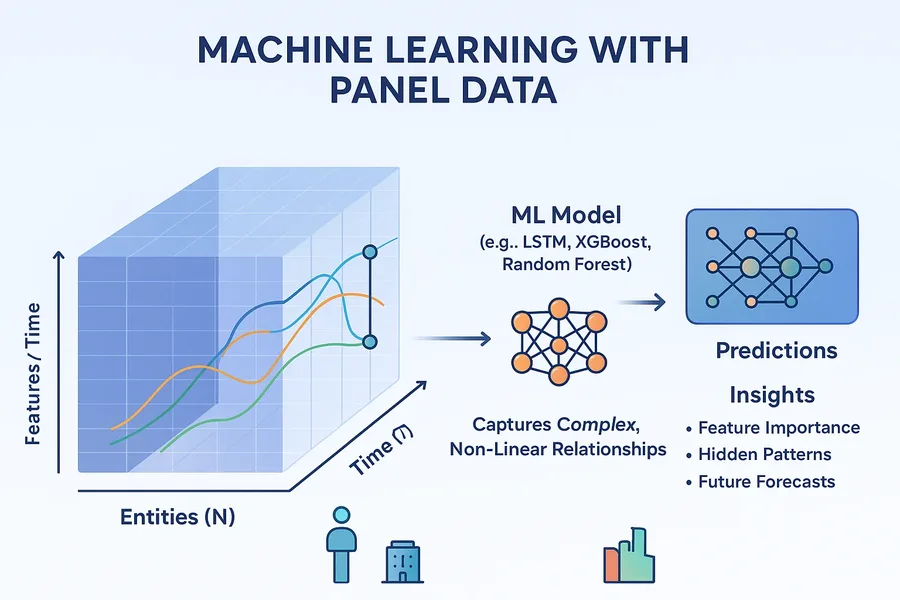
IntroductionIn the evolving landscape of econometrics, panel data—a dataset that tracks multiple entities over time—has long been a gold standard for understanding dynamic economic behaviors. From evaluating policy impacts to forecasting market trends, its ability to capture both cross-sectional and temporal variations makes it indispensable. However, the rise of machine learning (ML) is reshapin…
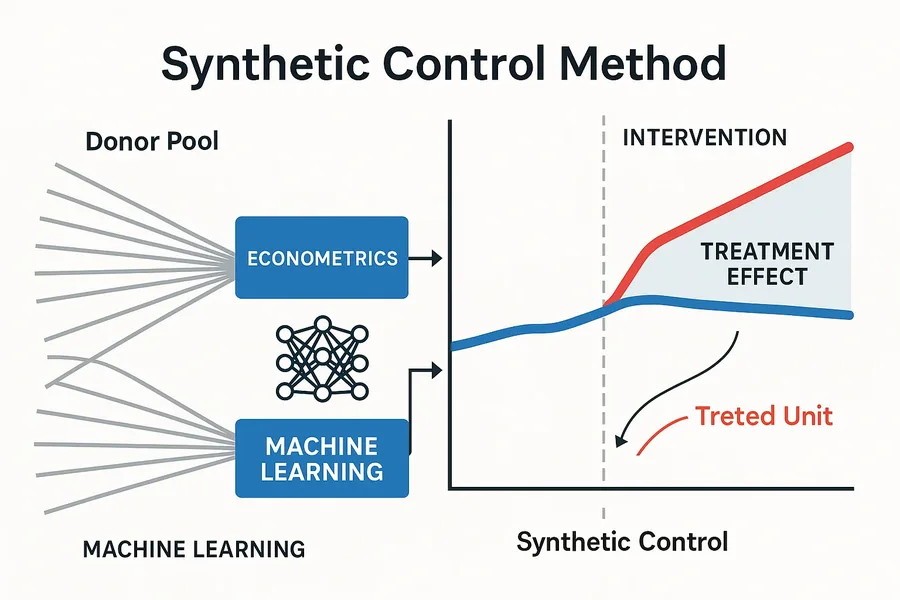
Synthetic Control Methods (SCM) with Machine Learning (ML) and traditional econometrics share the goal of causal inference, but they differ fundamentally in their approach, assumptions, tools, and applications. Here’s a breakdown of their key differences: 1. Core Philosophy & Methodology Traditional Econometrics SCM + ML Focuses on parametric models (e.g., linear regression, IV, DID…
Difference Between Panel Data and Cross-Section Data Cross-sectional data and panel data are two distinct types of data structures used in statistical and econometric analyses, each serving different research purposes. Cross-Sectional Data: Panel Data: Key Differences: Understanding these differences is crucial for selecting the appropriate data structure based on the research objectives and the …
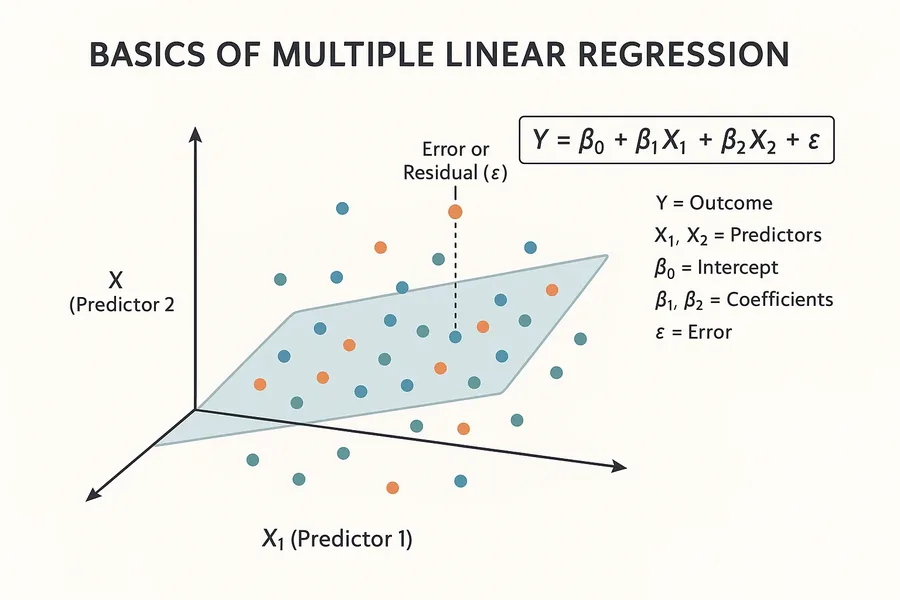
The Basics of Multiple Regression Analysis: A Step-by-Step Guide Multiple regression analysis is one of the most fundamental and widely used techniques in econometrics and data analysis. It is primarily used to understand the relationship between one dependent variable and two or more independent variables. This method allows researchers to isolate the effect of each […]
Quantile Regression for Economists: How to Analyze Data Beyond the Mean with Tailored Insights Quantile regression, introduced by Koenker and Bassett in 1978, is a technique that extends the traditional linear regression framework to estimate the conditional quantiles of the response variable rather than the conditional mean. In other words, instead of focusing solely on […]
Understanding Heterogeneous Treatment Effects: Methods for Estimating and Interpreting in Observational Studies In the realm of observational studies, understanding how treatments affect different individuals is crucial for accurate policy making, healthcare decisions, and scientific research. This brings us to the concept of heterogeneous treatment effects (HTE), which refers to the variation in…
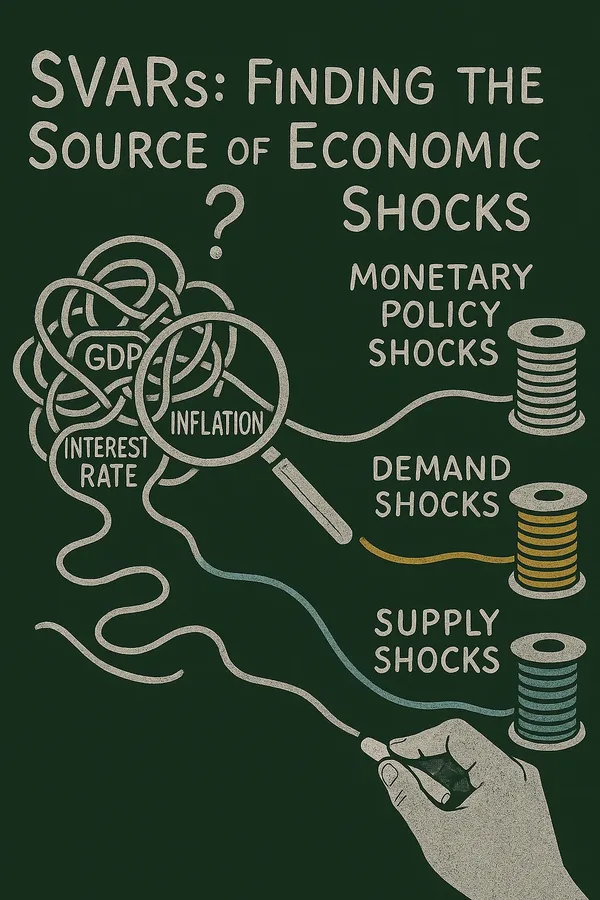
Structural Vector Autoregressions In the realm of macroeconomic analysis, Structural Vector Autoregressions (SVARs) have emerged as a vital tool for identifying and understanding the impact of structural shocks on economic systems. Unlike standard Vector Autoregressions (VARs), SVARs incorporate theoretical constraints to discern structural shocks and their effects, making them essential for eval…