Srajit Bali Mathur & Tarushi Jain, Bennett University ABSTRACT Insider trading is a process of trading securities by people who have certain material information not known or available to the public. It has heavy legal ramifications as well as ethical. Although insider trading is prohibited in India, still it has not gained the desired strength of enforcement. This paper involves an in-depth …
_International Journal for Multidisciplinary Research_ 7 (1):1-17. 2025This paper presents a comprehensive review of the latest development in Generative AI and Big Data with application in Finance. 2025 is the year of Agentic AI, marking a pivotal shift in generative AI (Gen AI) and its integration with big data. This paper explores the synergies between Gen AI and big data, particularly in fina…
What if you could type a stock ticker and get more than just its current price? I wanted to build something that could combine real financial data, fundamental valuation, and recent market information into one place. So I built StockAny AI — an AI-powered equity research and valuation terminal. 👉 GitHub: https://github.com/iPrq/Stock-Market-Analyser The idea is simple: Enter a ticker → fetch fina…
I am aware of the differences between an Exponentially Weighted Moving Average (EWMA) and a Simple Moving Average (SMA), with the weights of the latter being fixed and equal for each observation in the calculation compared to exponentially decaying weights for the former. Is there a rule of thumb to relate the lookback-period / formation-period of a SMA to the half-life of an EWMA? In other words…
I want to calculate the exponential moving average for many stocks in a large investable universe. To do this, I've seen the following formula: $EMA_n = p_n\frac{2}{T+1}+EMA_{n-1}\left(1-\frac{2}{T+1}\right)$ Because it references the previous day's exponential moving average, it seems to me like I would need to calculate the exponential moving average for every day going back to the security's i…
A rigorous but accessible derivation of geometric Brownian motion - the SDE, the closed-form solution via Ito's lemma, the log-normal distribution, exact simulation, and its role in Black-Scholes and Monte Carlo pricing.
Every financial statement exists in at least two versions: the number a company first told the market, and whatever number ends up in today's database after amendments, reclassifications, and restatements. If you're building a fundamental backtest, confusing the two is one of the quieter ways to inflate a strategy's historical returns — quieter than survivorship bias, but just as real. This artic…
Forecasting corporate earnings growth is fundamental to investment, credit, and regulatory decision-making. Existing forecasting approaches either rely on restrictive linear assumptions or provide limited interpretability, making them less suitable for high-stakes financial applications. This study proposes a transparent and causally informed framework for predicting future corporate earnings gro…
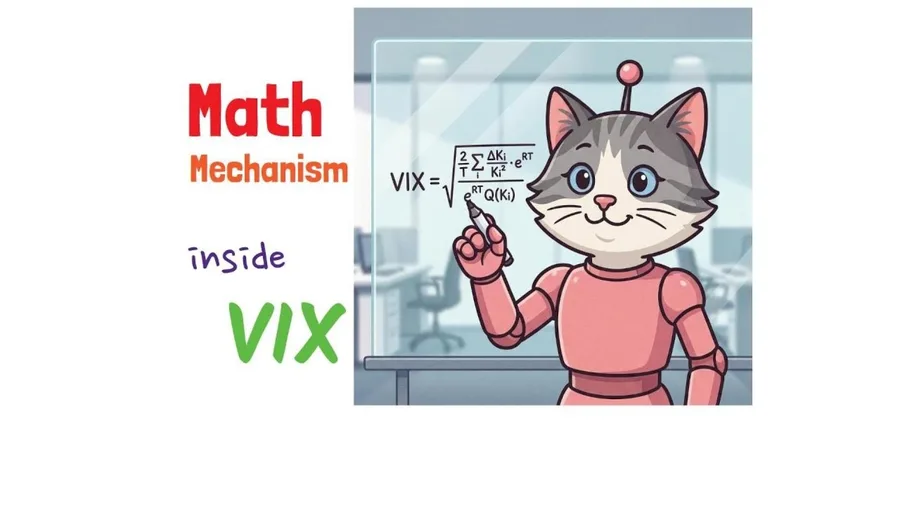
A quantitative walkthrough of the VIX — how it's calculated, the market microstructure behind it, and the trading mechanics that drive its behavior.
🎥 Video Tutorial
🎥 Watch Video: https://youtu.be/IXumgPJ5D-A
Topics: quantitative finance, investment analysis, financial education, financial education video, trading tutorial
I recently have started to look at some data from CRSP, and they have a metric called Value Weighted Return (two versions with and without distributions). When I looked it up, it seemed that this metric was not used anywhere else, and the explanation on the site did not help (quoted below): VWRETD indices contain either the daily or monthly returns, including all distributions, on a value-weighte…
I've taken three months of price return data for two instruments and calculated a $\beta$ between the two using the formula $\beta = \frac{Cov(x,y}{Var(y)}$ with the goal of estimating what the percentage change in instrument $y$ should be based on what the percentage change in instrument $x$ is. I have been applying this by multiplying $\beta$ by the percentage change of $x$ to determine a beta-…
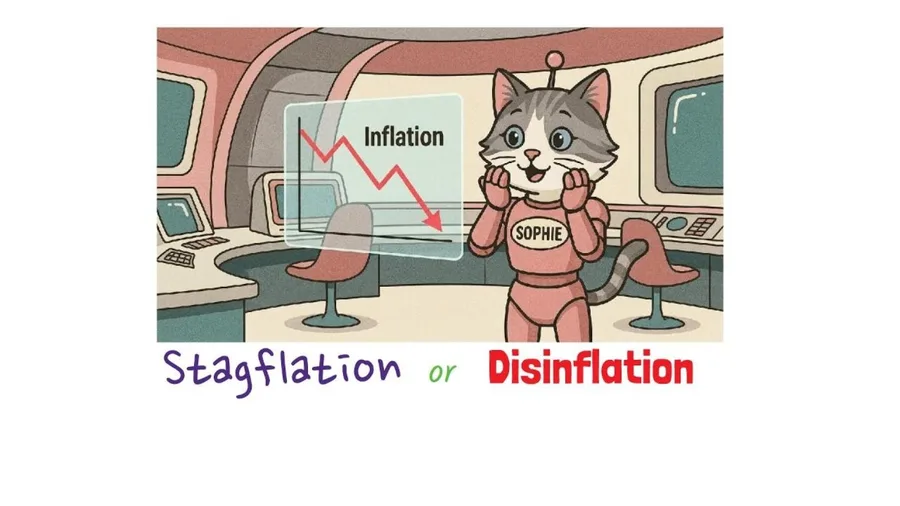
Examines how the 2026 Strait of Hormuz oil shock — which sent Brent crude to $118/barrel — failed to trigger stagflation, tracing the collapse in inflation expectations to the "Warsh Effect," Fed Chair Kevin Warsh's break from forward guidance.
🎥 Video Tutorial
🎥 Watch Video: https://youtu.be/ltbC23TpuM0
Topics: quantitative finance, investment analysis, financial education, financial educatio…





 research.io