


A production AI agent throws an error, and whoever's on call is left staring at a stack trace with no context attached. Was it a failed tool call? Did the conversation history blow past the model's context window? Is the agent stuck retrying the same broken step for the third time this hour? None of that is obvious from the raw trace, so someone works it out by hand, the same way they did for the last one, and the one before that. Here's the part that's easy to miss: these failures aren't random. Most agent errors sort into a small number of repeatable categories, whether or not anyone's bothered to name them. Five Categories, Not Fifty Tool call failures happen when a request to an external API, database, or function comes back broken. Context window exhaustion shows up after a long chain of tool calls with nothing summarizing the history in between. State corruption is what you get when an agent's internal memory lands somewhere the logic never accounted for. Retry loops are an agent repeating the same failed step without making progress. Then there's a fifth bucket that matters just as much as the other four: uncertain. It's the honest label for an error that doesn't cleanly fit anywhere else, and admitting that beats forcing a confident-sounding guess that turns out to be wrong. Where Manual Triage Breaks Down Reading traces by hand works fine when errors are rare. It stops working the moment an agent handles real traffic. The same failure types resurface constantly, but nothing tracks that they've been seen before, so each one gets diagnosed from scratch. Duplicate alerts from a single underlying bug pile into the same Slack channel and bury the one alert that actually needs attention. Without any signal for severity, everything reads as equally urgent. In practice, that means nothing does. Teams either burn hours on triage they shouldn't need, or start muting the channel altogether, which defeats the entire point of having monitoring in the first place. What an Automated Triage Layer Actually Does The fix isn't more dashboards. It's a layer that sits between the error and the human, and it usually works in four steps. A webhook accepts the incoming failure, whether that's a native error-tracking payload or a plain JSON body from something custom. A dedup step fingerprints the error and checks it against a rolling time window, so the same bug doesn't generate ten separate pings. Anything new gets sent to a model running against a fixed classification rubric, which returns structured output: a category, a confidence score, a severity rating, and a short explanation of its reasoning. Low-confidence results get flagged uncertain instead of forced into the wrong bucket. From there, the system matches the category to a fix playbook and posts a complete report, confidence, severity, the original error, a summary, and suggested next steps, so whoever's on call gets a diagnosis instead of a raw log line. For teams that want to see this wired up node by node, there's a fully documented AI agent monitoring workflow built on n8n that walks through the whole chain, from webhook to Slack report. Keeping the Stack Simple None of this requires buying an enterprise observability platform. A self-hosted automation tool keeps the whole pipeline under your own control, and the classification step doesn't lock you into one AI vendor. As long as the model returns valid structured output, the rest of the workflow doesn't care which one produced it. The error source is flexible too; anything capable of sending a JSON payload to a webhook can feed into the system, with or without a dedicated error tracker in front of it. IT Path Solutions, which built this workflow, uses a triage layer like this as a practical first step when an agent moves from a demo into real production traffic. It gives teams a way to monitor and route issues without immediately investing in a full observability platform. The Trade-offs Worth Knowing First Classification quality depends entirely on how much detail sits inside the error being classified. A stack trace with a clear culprit and exception type gives a model something to reason about. A log entry that just says "failed" gives it nothing, and a well-built workflow will correctly call that uncertain rather than invent a category to fill the gap. There's usually no human approval gate by default. Everything posts automatically once classification finishes. That's fine for most teams, but worth revisiting before a high-severity label is allowed to trigger anything downstream on its own. And if you're relying on a free-tier model for classification, check current rate limits before betting real production volume on it. Those limits shift more often than people expect. One more thing worth building in from day one: credentials belong in a secrets manager, never hardcoded into workflow files that might get exported, shared, or checked into version control. None of this replaces good engineering judgment. It just means the part where someone has to guess what broke, the first ninety seconds of an incident, happens automatically, so the humans on call spend their time fixing the problem instead of diagnosing it.
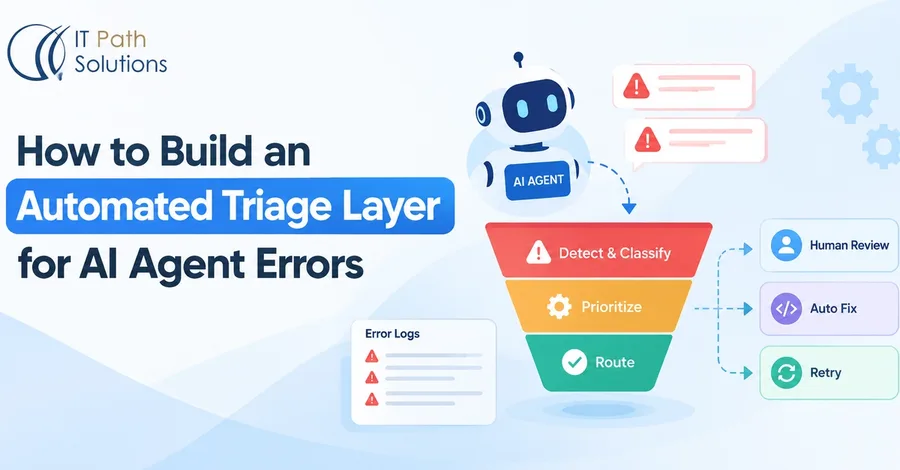
How to Build an Automated Triage Layer for AI Agent Errors
Glen Allen