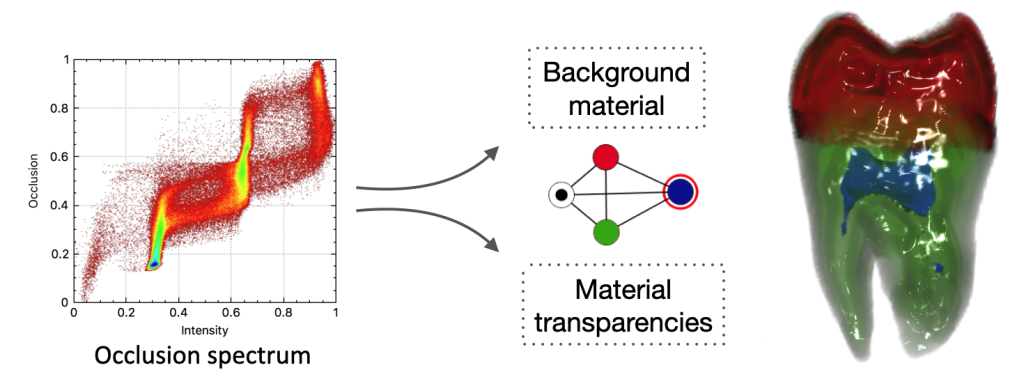
Under the CS Katha Barta of CSE department at NISER, Dr. Ojaswa Sharma delivered a talk on “Medical Volume Visualization for better Inference” on 16 November 2021. Talk abstract: Volume visualization is a technique in computer graphics where a 3D scalar field The post CS Katha Barta Talk on “Medical Volume Visualization for better Inference” appeared first on Graphics Research Group .
SONIC PhD student Jackie Ng took home the gold in the Northwestern University Computational Research Day Visualization Challenge for her presentation on Nebula , an innovative new tool that uses network science to visualize discussion board threads. For winning first place, Jackie received an NVIDIA GeForce Titan X graphics card which retails for over $1,000! … Read the rest
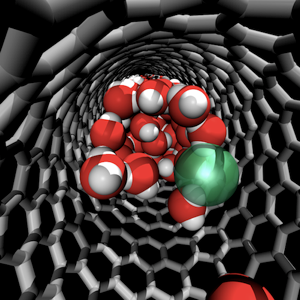
Visualizing with VMD & rendering with POV-Ray
While XCrysden is a great tool for checking your PWscf input for bugs, visualizing NEB pathways and charge densities, this tutorial will show you how VMD can provide powerful tools for visualizing results as well.
Getting started with VMD to visualize Quantum-ESPRESSO results:
- Choose what you will visualize and load the files:
Today, I’ll only be go…