This blog focuses on helping traders identify market trends and make more confident trading decisions using five popular technical indicators: Moving Averages, ADX, MACD, RSI, and Bollinger Bands. Each is explained with examples and accompanied by Python code snippets to help you implement them in your own strategy.
Before diving into this blog, it’s important to understand the fundamentals of te…
By Ishan Shah
Fibonacci trading tools are used to determine support/resistance levels or to identify price targets. It is the presence of the Fibonacci series in nature which attracted technical analysts’ attention to use Fibonacci for trading. Fibonacci numbers may work like magic in some cases, in finding key levels in any widely traded security. Fibonacci's retracement strategy relies on key r…
Technical analysis is an important part of both day trading and investing. It has several parts, including using technical indicators like moving averages and the Relative Strength Index (RSI). It also involves price action analysis, which involves using chart patterns like triangles, rectangles, and head & shoulders. The other part of technical analysis is the […] The post 7+1 Best Leading Indi…
Ever wondered how to use technical indicators to make the right moves in the market?
Or, how embracing technical analysis and indicators can serve as a potent catalyst for enhancing your trading success?
If you're on the hunt for a rad blog to learn all about technical analysis, look no further. This list of technical analysis blogs offers a comprehensive, unique, and free resource for learning a…
quant-financetechnical-analysis
Quantitative Finance & Algo Trading Blog by QuantInsti
By Rekhit Pachanekar and Chainika Thakar
Bollinger Bands, a widely acclaimed technical analysis tool, has become an indispensable asset for traders seeking to navigate the turbulent waters of financial markets. Developed by John Bollinger in the 1980s, these bands offer a unique perspective on price volatility, helping traders make informed decisions.
In this comprehensive guide, we delve into th…
quant-financetechnical-analysistrading-strategy
Quantitative Finance & Algo Trading Blog by QuantInsti
Welcome to our beginner's guide on bullish candlestick patterns - the key to unlocking market trends and making smarter trading decisions.
First things first, we'll walk you through what a candlestick is and how to read candlestick charts.
But do you know how to identify bullish patterns with confidence and validate them with other indicators?
We will learn everything about the bullish candlestic…
quant-financetechnical-analysis
The Scientific World - Let's have a moment of science
Successful online trading in South Africa requires market research, risk management, and strategic planning. Traders benefit from regulated platforms, diverse asset options, and advanced trading tools. Understanding economic trends, currency fluctuations, and local regulations enhances profitability. With education, discipline, and technology, South African traders can navigate financial markets …
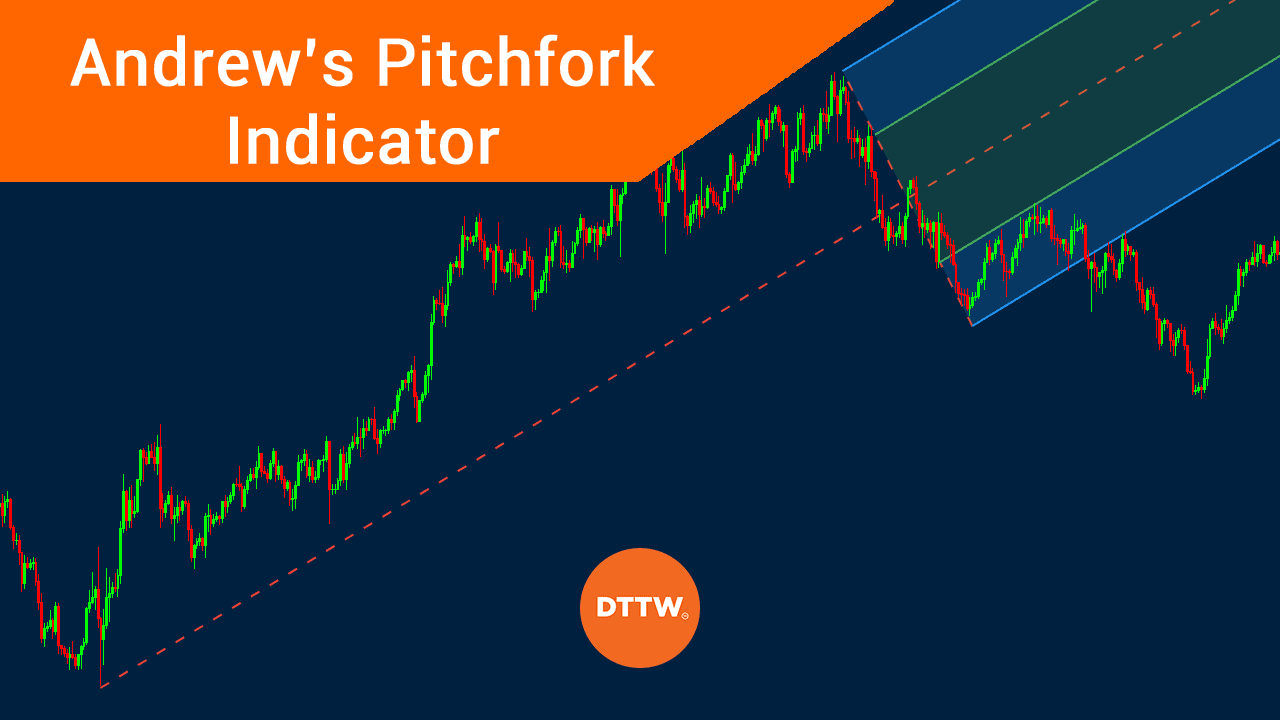
Andrews pitchfork is an important technical analysis tool that helps traders and investors identify potential support and resistance levels. The tool was developed by Alan Andrews, a statistician, and trader. Today, the tool is provided for free by all trading tools like the TradingView and the MetaTrader. In this article, we will look at what […] The post Andrew’s Pitchfork for Identifying Trend…
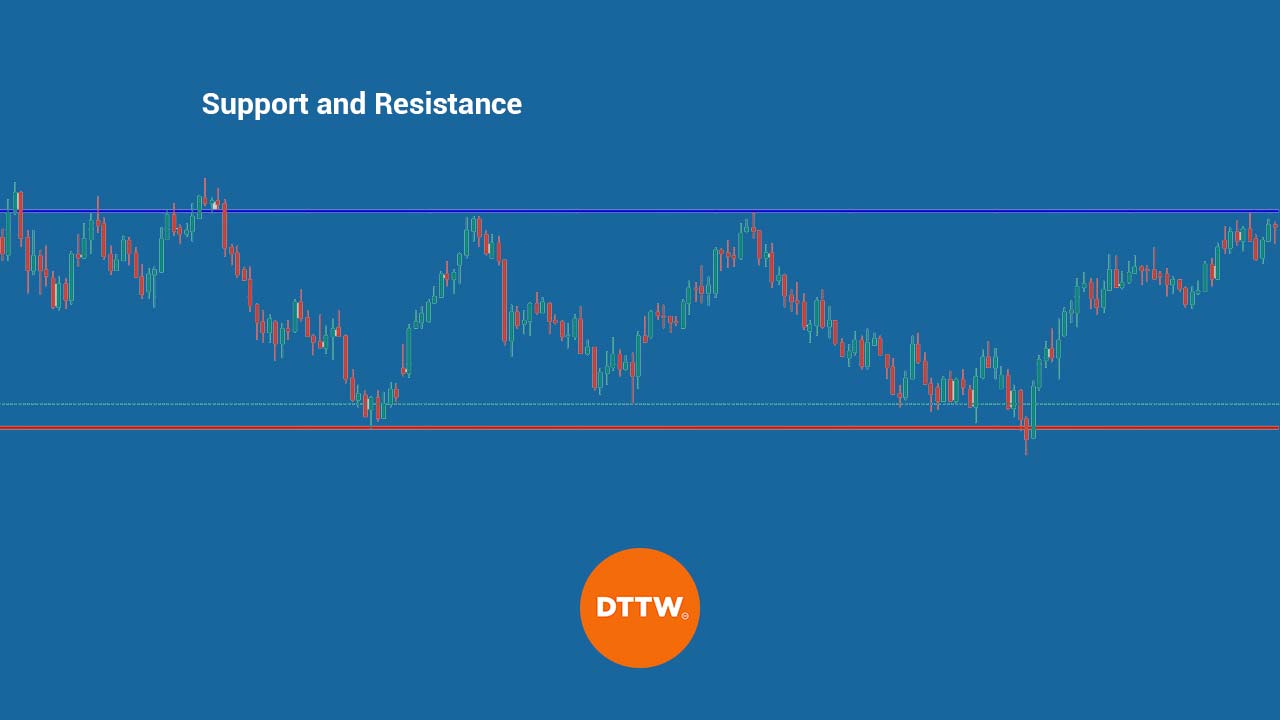
Traders use multiple strategies to trade in the financial market. Identifying patterns is one of the most common strategies in Day Trading. And using Support and Resistance will give you many advantages! In other articles, we have looked at concepts like technical analysis and fundamental analysis. Another common strategy used by traders is price action, which […] The post How to Find Support an…
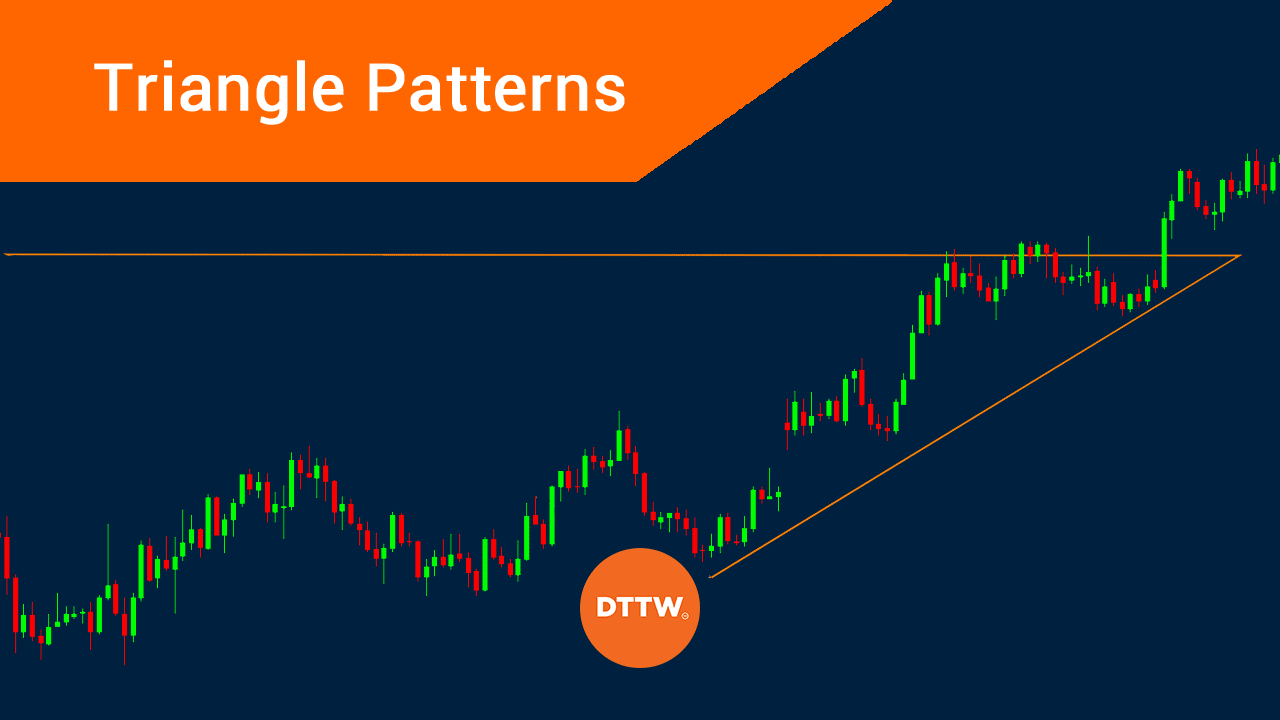
Traders use various approaches to predict the future direction of a financial asset. One of the most common approaches is technical analysis, where they use various indicators to make predictions. Another approach is known as price action. In price action, they observe various patterns in the market and use this information to make predictions. In this […] The post The use of Triangle Chart Patte…
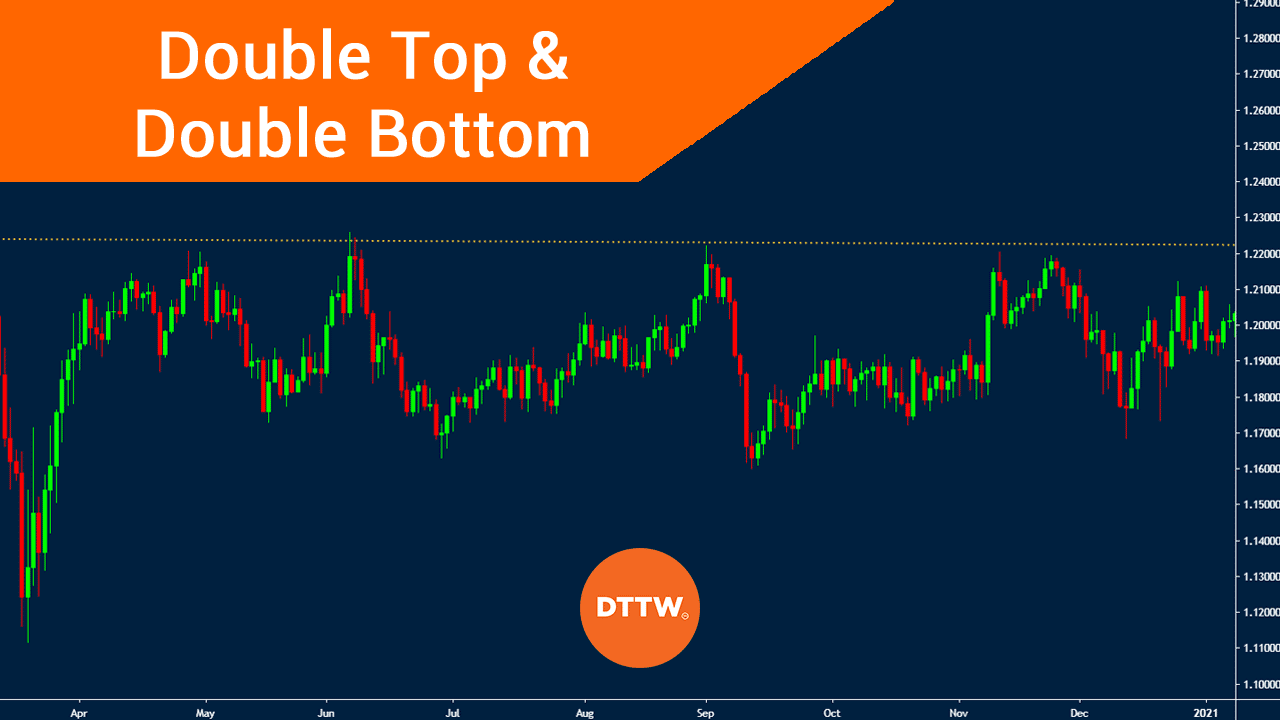
Chart patterns are important features used in the price action trading strategy. They refer to the process of looking at charts on all timeframes and then identifying the various patterns. You can then use these patterns to predict the future movement of a financial asset. In the past, we have looked at other chart patterns […] The post Double Top and Double Bottom Patterns in Trading Explained! …
Technical analysis is an important concept in trading. It involves using mathematical models and tools to predict the next price movements of an asset. As we have looked at before, there are different types of technical indicators, including volume and trend. In this article, we will look at indicators known as oscillators and explain what […] The post Trading with Oscillators: Best Practices and…
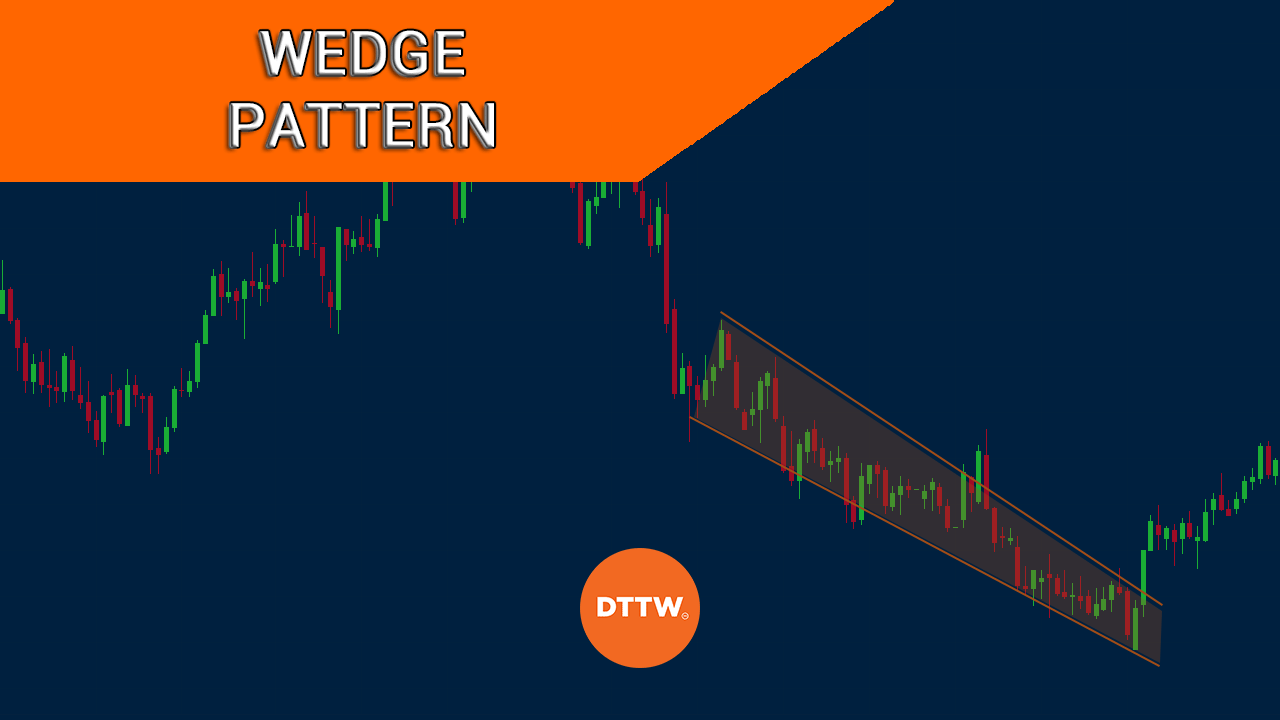
Chart patterns play an essential role for traders using both technical analysis and price action-related strategies. In the past, we have covered several chart patterns such as triangle, engulfing, and morning star, among others. In today’s report, we will look at another interesting pattern known as the wedge pattern and how you can use it […] The post Rising & Falling Wedge Pattern Explained fo…
Volume Spread Analysis is one of the most important concepts of technical analysis. This concept has been clarified by Dr Alexander Elder, one of the biggest developers of technical tools and authoring a number of top-selling financial books. Two of his most successful books are the new trading for a living and come to my trading […] The post Volume Spread Analysis: What Is It & Key Concepts That…
As you have noted by now, there are several types of charts you can use in the markets. These include: Nonetheless, candlesticks are the most important types of charts used in the market today. These charts have been in use for centuries (they started being used in Japan in the 17th century). There are several types […] The post Doji Candlestick Pattern: Best Ways to Identify Reversals appeared f…
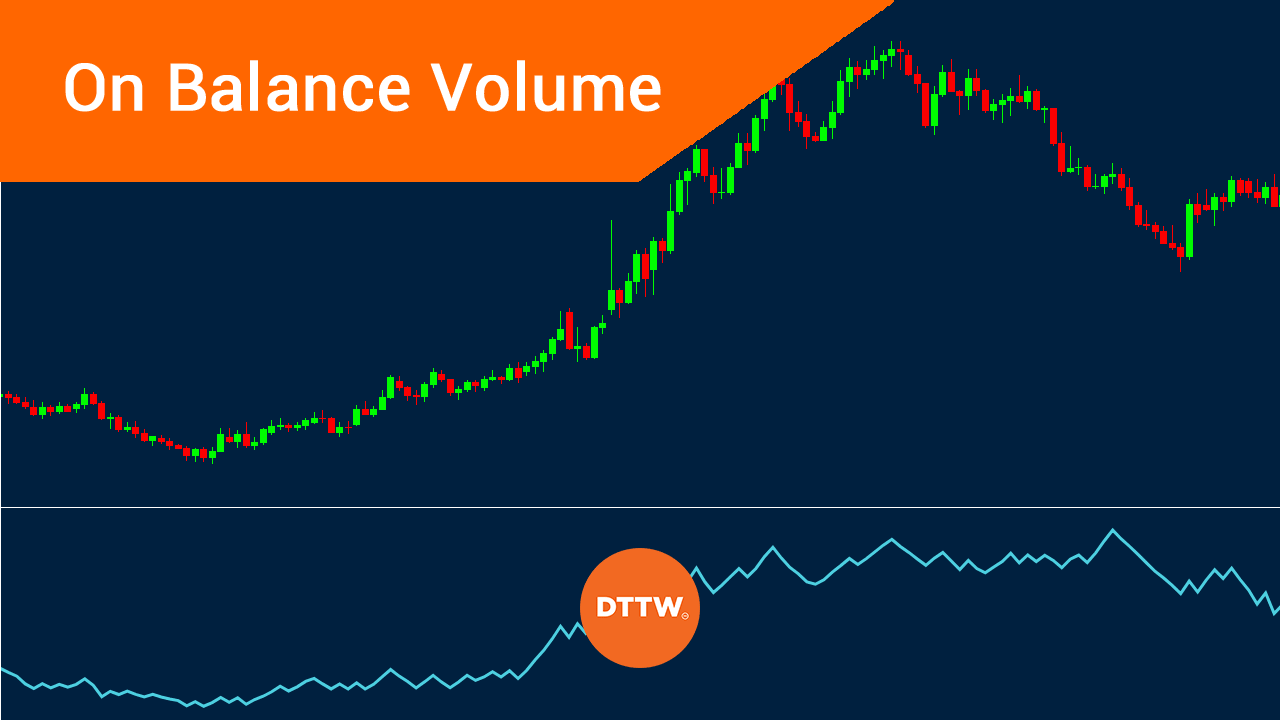
Technical analysis is one of the two methods of analysis when it comes to financial trading. Fundamental analysis is involves looking at the economic, political, and macro events and analysing their impact on currencies and stocks. It is a good method that has had significant results over the years. Technical analysis on the other hand […] The post How to Use the OBV Indicator? On-Balance Volume …
quant-financetechnical-analysis
Quantitative Finance & Algo Trading Blog by QuantInsti
By Mario Pisa Peña
In this post, we will review the well-known technical analysis pattern called Head and Shoulders and we will analyze the trading rules that will allow us to take advantage of this price configuration to take a position in the market.
Candlestick patterns are one way to interpret the price trend of a particular asset.
The main points we will review in this post are:
In this post…